DIVERSITY INDICES FOR COMMUNITIES
Here, I will show the importance of the abundance, richness, evenness, and diversity concepts. Besides I explain in raw terms, the Shannon index, the Simpson index, the Chao value, and the ACE value.
Summary
Details
Phyloseq links
Some references
Summary…
Abundance
- Raw number of individuals
- Sensitive and used to compare very different habitats/timepoints.
Diversity
- Importance:
- It is used to compare communities
- It defines the functioning of the communities: processes/ physical properties
- Definition: A combination of the number of species (richness) and their relative abundance (evenness)
- Richness: The number of different species in a sample.
- Large richness values are associated with metabolic diversity and complex social interactions
- Some richness indices are a way to measure your sampling effort.
- Chao1 and ACE have been developed to estimate richness, and they calculate expected OTUs based on observed OTUs.
- Chao1: Only the singletons and doubletons are used to estimate the number of missing species
- For high richness samples
- ACE: The ACE method divides observed frequencies into abundant and rare groups
- For low richness samples
- Evenness: Measure of how similar the species counts are in a sample; it integrates the proportion of species.
- Diversity indices
- Shannon index (H’): Measure of the degree of uncertainty in predicting the identity of the next individual sampled in a community of S species and N individuals
- Minimum value of H′ is 0, and increases as species richness and species evenness increase
- Assumptions: More weight to rare species; a community dominated by multiple species in lower proportions will be more equilibrated.
- Problems: Sampling effort
- Simpson diversity (D): Probability of getting the same specie after sampling two independent times in an infinite sample
- Types
- Without replacement: for large datasets
- With replacement: for small datasets
- Inv
- Gill-Simpson
- Defined between 0-1: lower values mean high diversity in the classic formulas
- Problems: for the replacement formula, very rare species are dismissed.
- Types
- Shannon index (H’): Measure of the degree of uncertainty in predicting the identity of the next individual sampled in a community of S species and N individuals
- Chao1: Only the singletons and doubletons are used to estimate the number of missing species
- Chao1 and ACE have been developed to estimate richness, and they calculate expected OTUs based on observed OTUs.
- Richness: The number of different species in a sample.
Some details…
Why should I be interested in a community diversity? O.o
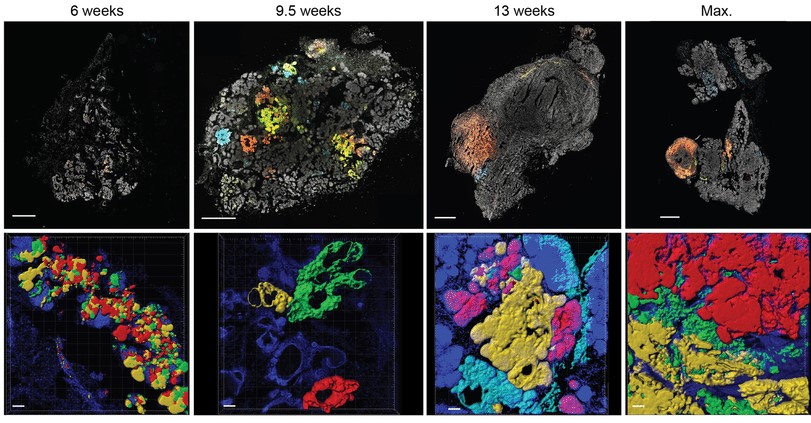
The dynamics of a system is chiefly affected by the total number of components and the number of classes in it; the same principle applies in a biological community, in this case, the number of individuals, number of species, and the number of individuals per specie can define the functioning of a community and some physical properties. In the dynamic/functioning view, higher diversity values are usually associated with biological properties like robustness and adaptability. Some mathematical formalisms have supported this hypothesis, the network theory comes to my mind; but, in biological terms, cancer is the perfect example. Although the different cancer populations are not defined as new “strains” or species, is undeniable that the cancer is comprised by cells with great genotypic/phenotypic diversity. The cell phenotypes richness in cancer increases the probability of drug resistance, immunosuppression, metastasis, etc. By the physical point of view, higher diversity indices are usually associated with higher biomass production. Therefore, diversity measures are traits of the biological systems, we can use it as a parameter to compare communities.
Fig. 1 – Cancer is an example of the effects of diversity: Temporal and spatial heterogeneity in primary breast tumors a Representative fluorescence microscopy images (upper panels) and 3D reconstructions (lower panels) of color-induced mammary gland tumors of MMTV–PyMT;R26-CBW;K8-CreERT2 mice at 6, 9.5, and 13 weeks of age or when the maximum tumor volume had been reached.
ABUNDANCE, RICHNESS, EVENNESS: THE BUILDING BLOCKS
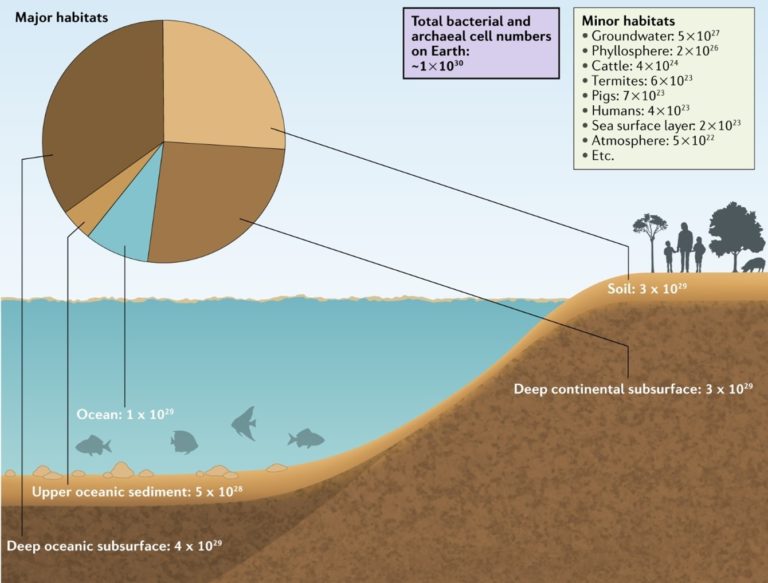
There are different ways to compare the number of Bugs in a sample. The easiest way is to count the raw number of individuals, which is defined as abundance. Nevertheless, this number is very sensitive; you can estimate the abundance of the same community at different timepoints, it may change by chance. This does not mean it is useless, abundance is frequently used as a first glance of your samples and to compare very different environments/time points. For example, you may not need more information if you are testing a sanitizer for your desk, in this case, only you need to reduce the raw number of microorganisms in it. On the other hand, the bacteria and archaea abundances have significant changes across habitats, it is informative (fig. 2).
Fig. 2 – The abundance index is used to compere very different communities: In total, ~1.2 × 1030 bacterial and archaeal cells exist on Earth… (sorce)
Beyond abundance, the richness measure refers to the number of different species in a sample. Large richness values are associated with metabolic diversity and complex social interactions. More species mean more genotypes, but it also means more competition/cooperation. The antibiotics, which are already important for human development, where extracted from antagonist bacteria to our pathogens, the high diversity in the microworld lead to higher incidences of competitivity, therefore, to the innovation of antibiotics. I will return to this topic in the last paragraph.
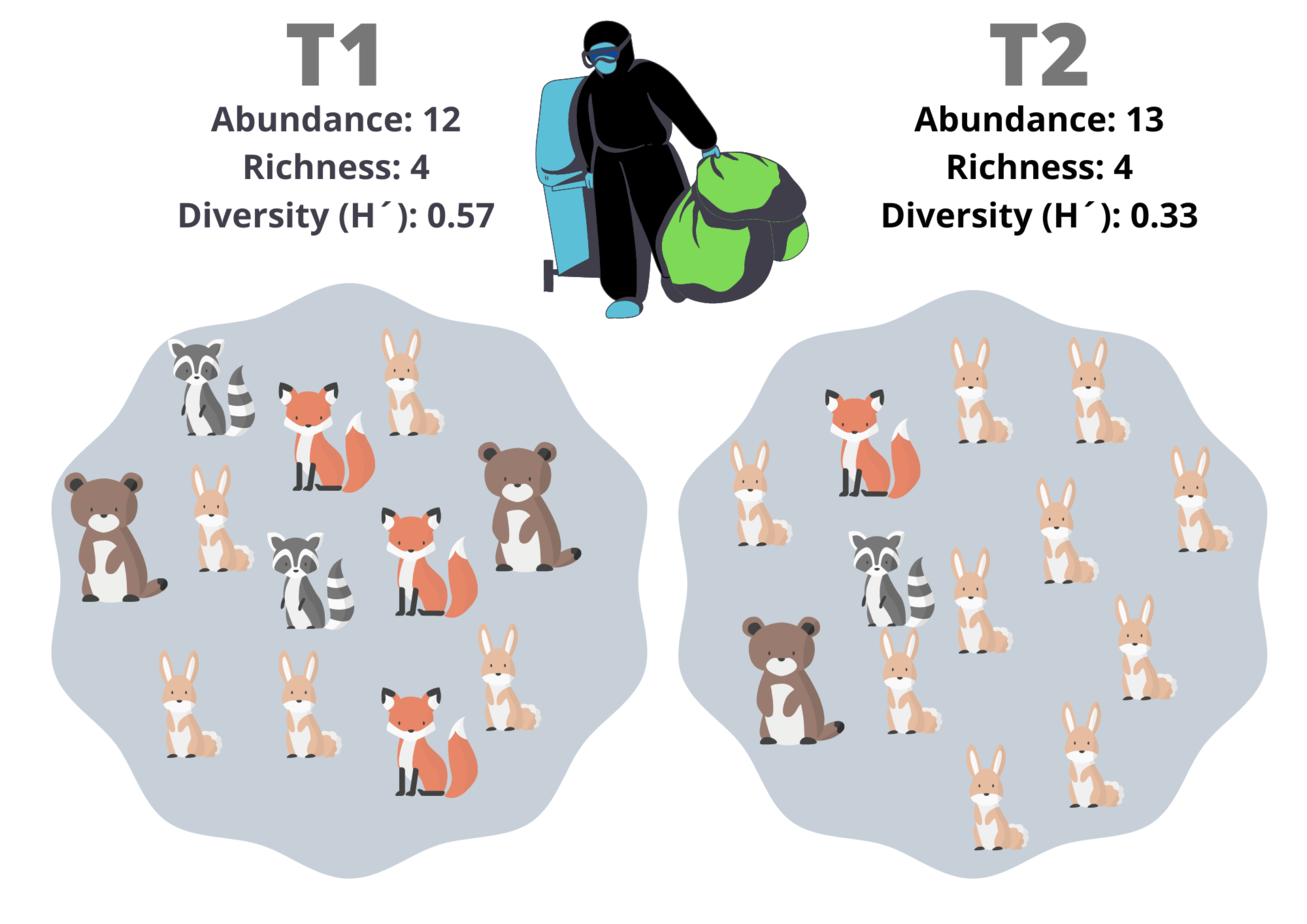
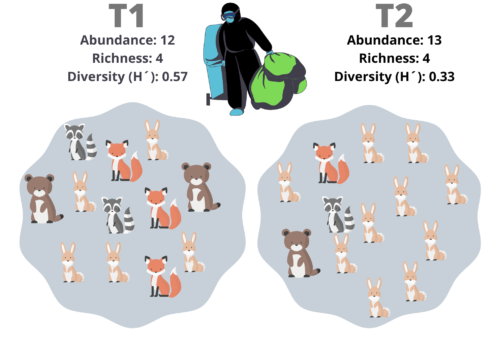
I will point out that, neither of the two last numbers incorporates the proportion of individuals of each specie. Let´s say that you want to measure the effects of a river contamination in the woods, like in Fig. 3. T1 is the sample pre-contamination, and T2 is the post-contamination sample. T1 has Abundance = 12 and Richness = 4 (12 animals and 4 species), and T2 has Abundance = 13 and Richness = 4. We could think that the change in the abundance is a consequence of random effects; on the other hand, the richness is the same, but the community structure was changed. The evenness is a measure of how similar the species counts are in a sample; it integrates the proportion of species, not the number of species per se.
Fig. 3 – Different metrics of individuals counts: Two communities, one pre-contamination (T1), and one post-contamination (T2). Please note that the diversity index shows more differences between them.

NOW, DIVERSITY
In the past example, you could tell me, that, T1 and T2 are obviously different; but, how much? In science, we like the numbers. A combination of the number of species (richness) and their relative abundance (evenness) defines species diversity. There are multiple ways to integrate these two concepts into a measure, but all of them allow us to compare communities. Besides, some diversity indices have a defined scale (Simpson index is defined between 0 and 1), while the abundance and richness are relative numbers, we need a point of comparison.
SHANNON INDEX (H’)
The Shannon index is the most used measure of diversity in microbiology. As suggested by its name, the index is related with the information theory. Formally speaking, “the Shannon index is a measure of the degree of uncertainty in predicting the identity of the next individual sampled in a community of S species and N individuals” [Magurran, 2004]. The Shannon index is defined as the following equation (Fig. 4).
Fig. 4: Shannon index equation
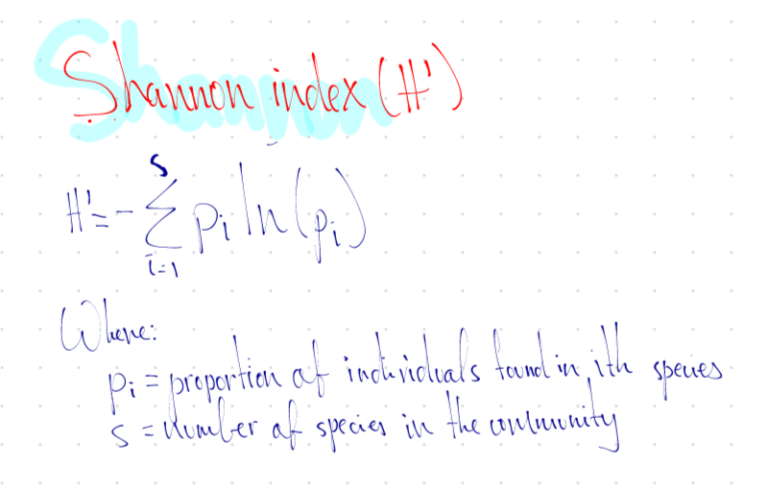
“The minimum value of H′ is 0, which is assigned to a community with a single species and increases as species richness and species evenness increase” [ Magurran, 2004]. However, it the richness has more weight in the Shannon index.
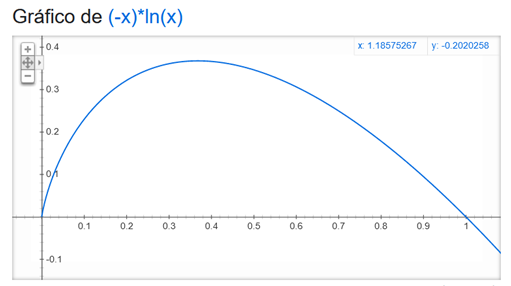
Fig. 5 shows the f(x) = – x ln(x) graph, the equation corresponds to the – pi log(pi) part of Shannon formula. It is defined between 0-1 (x values) because the pi values correspond to the proportion of each specie (no raw counts). You must pay attention in how the function assigns lower values to the higher proportions, if a community is dominated by only a specie, it would get a lower Shannon index value. On the contrary, the lower proportion values (x) have higher numbers in the equation; therefore, the Shannon index gives more weight to rare species; it assumes that a community dominated by multiple species in lower proportions will be more equilibrated. The main problem with the Shannon index is that, if you do not have complete coverage of the species in a community, the Shannon index will be an underestimate; and, the rare species can be more easily missed in the sampling process.
Fig. 5 – The shannon index gives more weigth to the rare species: f(x) = x * ln (x) shows the value per specie in the shannon equation. Remember that the negative of a sum can be defined as the sum of negative of each element in the sum. It is defined between 0-1 (x values) because the pi values correspond to the proportion of each specie (no raw counts)
SIMPSON’S DIVERSITY (D)
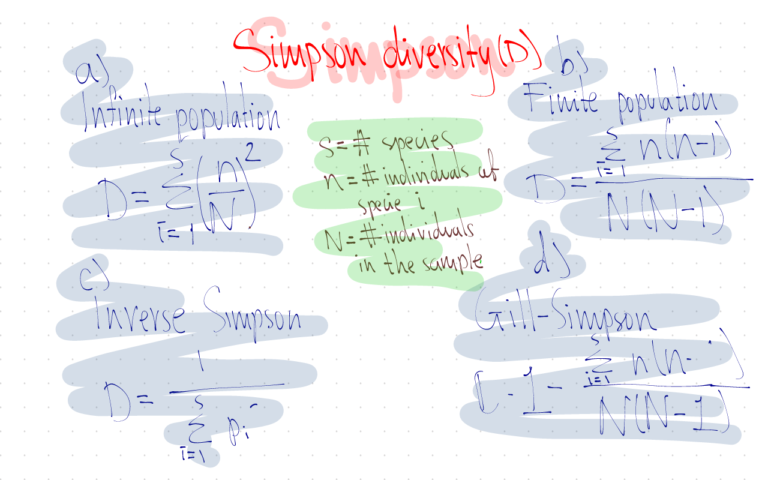
The Simpsons diversity represents the probability of getting the same specie after sampling two independent times in an infinite sample. I have little to add to the formula in Fig. 6a, this express the basic probability equation to get an object of type n in a sample N with replacement (infinite sample) and repeat this result in an independent experiment. This index gives more weight to the higher abundance species; therefore, you have less consequences if your sampling method dismiss the rare species.
The 6a formula is easy, however, it assumes replacement in the probability estimation. In a large dataset, this fact is irrelevant, because a larger dataset is more akin to an infinite community. Nevertheless, in small datasets, the replacement can inflate the probabilities of resampling by two-fold. For these cases, the equation of Fig. 6b is used.
Finally, let’s remember that a probability ranges in 0-1, so do the Simpson indexes, higher probabilities represent that the community is monopolized by a few species; therefore, higher Simpson values correspond to lower diversity. Since this fact can be counterintuitive to some people, the inverse Simpson index (Fig. 6c) and the Gini-Simpson index (6d) are used to transform a large Simpson index as a sign of high diversity.
Fig. 6 – The Simposon diversity equations: a) For infinite populations (sugested in abundant samples); b) For finite popukations (suggested for small samples); c) Inverse simpson and d) Gill-Simpson are suggested to make more intuitive conclusions
Richness indices: Chao1 and ACE (Abundance-Based Coverage Estimator)
I have emphasized how the diversity indexes are more informative than the richness values. However, some richness indices are a way to measure your sampling effort, we will talk about the Chao1 and ACE methods. Please be careful, some scripts mix the richness and diversity estimators, however, they measure different properties of the communities.
An excellent minireview about the diversity is in the next link, https://pubmed.ncbi.nlm.nih.gov/29032640/. Particularly, it makes an outstanding work explaining the Chao1 and ACE estimators; therefore, I will copy the explanation here.
An excellent minireview about the diversity is in the next link, https://pubmed.ncbi.nlm.nih.gov/29032640/. Particularly, it makes an outstanding work explaining the Chao1 and ACE estimators; therefore, I
will copy the explanation here.
“Chao1 and ACE have been developed to estimate richness, and they calculate
expected OTUs based on observed OTUs.
…
The Chao richness estimator was developed by Anne Chao and is based on the
concept that rare species infer the most information about the number of
missing species. … only the
singletons and doubletons are used to estimate the number of missing species. Therefore,
this index is particularly useful for data sets skewed toward the low-abundance
species.
The ACE is a nonparametric method for estimating the number of species
using sample coverage, which is defined as the sum of the probabilities of the
observed species. The ACE method divides observed frequencies into abundant and
rare groups. The abundant species are those with more than 10 individuals in
the sample, and the rare species are those with fewer than 10 individuals. … the
exact frequencies for the rare species are required because the estimation of
the number of missing species is based entirely on these rare species.” [Bo-Ra
Kim et al, 2017]
In a few words, if the sample contains many rare species, Chao and ACE will predict that a lot of more rare species where not identified by the sampling method and the Chao1 and ACE values will be higher. Frequently, the Chao and ACE values are higher than the observed OTUS. And some researchers suggest using the Chao index for high richness samples, and ACE for the low richness samples.
Phyloseq links…
Finally, there are libraries in different programming languages designed to estimate different diversity/richness/abundance indices. For example, whit a single command, phyloseq in R allows you to calculate the Simpson, Shannon, Inv. Simpson., richness, Chao1, and ACE indices (all at once and for multiple samples). And the input is an abundance table.
https://bioconductor.org/packages/release/bioc/html/phyloseq.html
https://www.rdocumentation.org/packages/phyloseq/versions/1.16.2/topics/estimate_richness
https://www.rdocumentation.org/packages/phyloseq/versions/1.16.2/topics/plot_richness
It is not necessary to know the formulas, however, you should know the meaning of your estimators.
Some references…
https://www.nature.com/articles/nature23886
https://www.nature.com/articles/s41579-019-0158-9
https://www.nature.com/scitable/knowledge/library/characterizing-communities-13241173/
https://www.science.org/doi/10.1126/science.1064088
https://royalsocietypublishing.org/doi/10.1098/rspb.2016.1437
https://www.jstor.org/stable/1934352
https://www.wiley.com/en-us/Measuring+Biological+Diversity-p-9781118687925
https://onlinelibrary.wiley.com/doi/book/10.1002/9781118015841