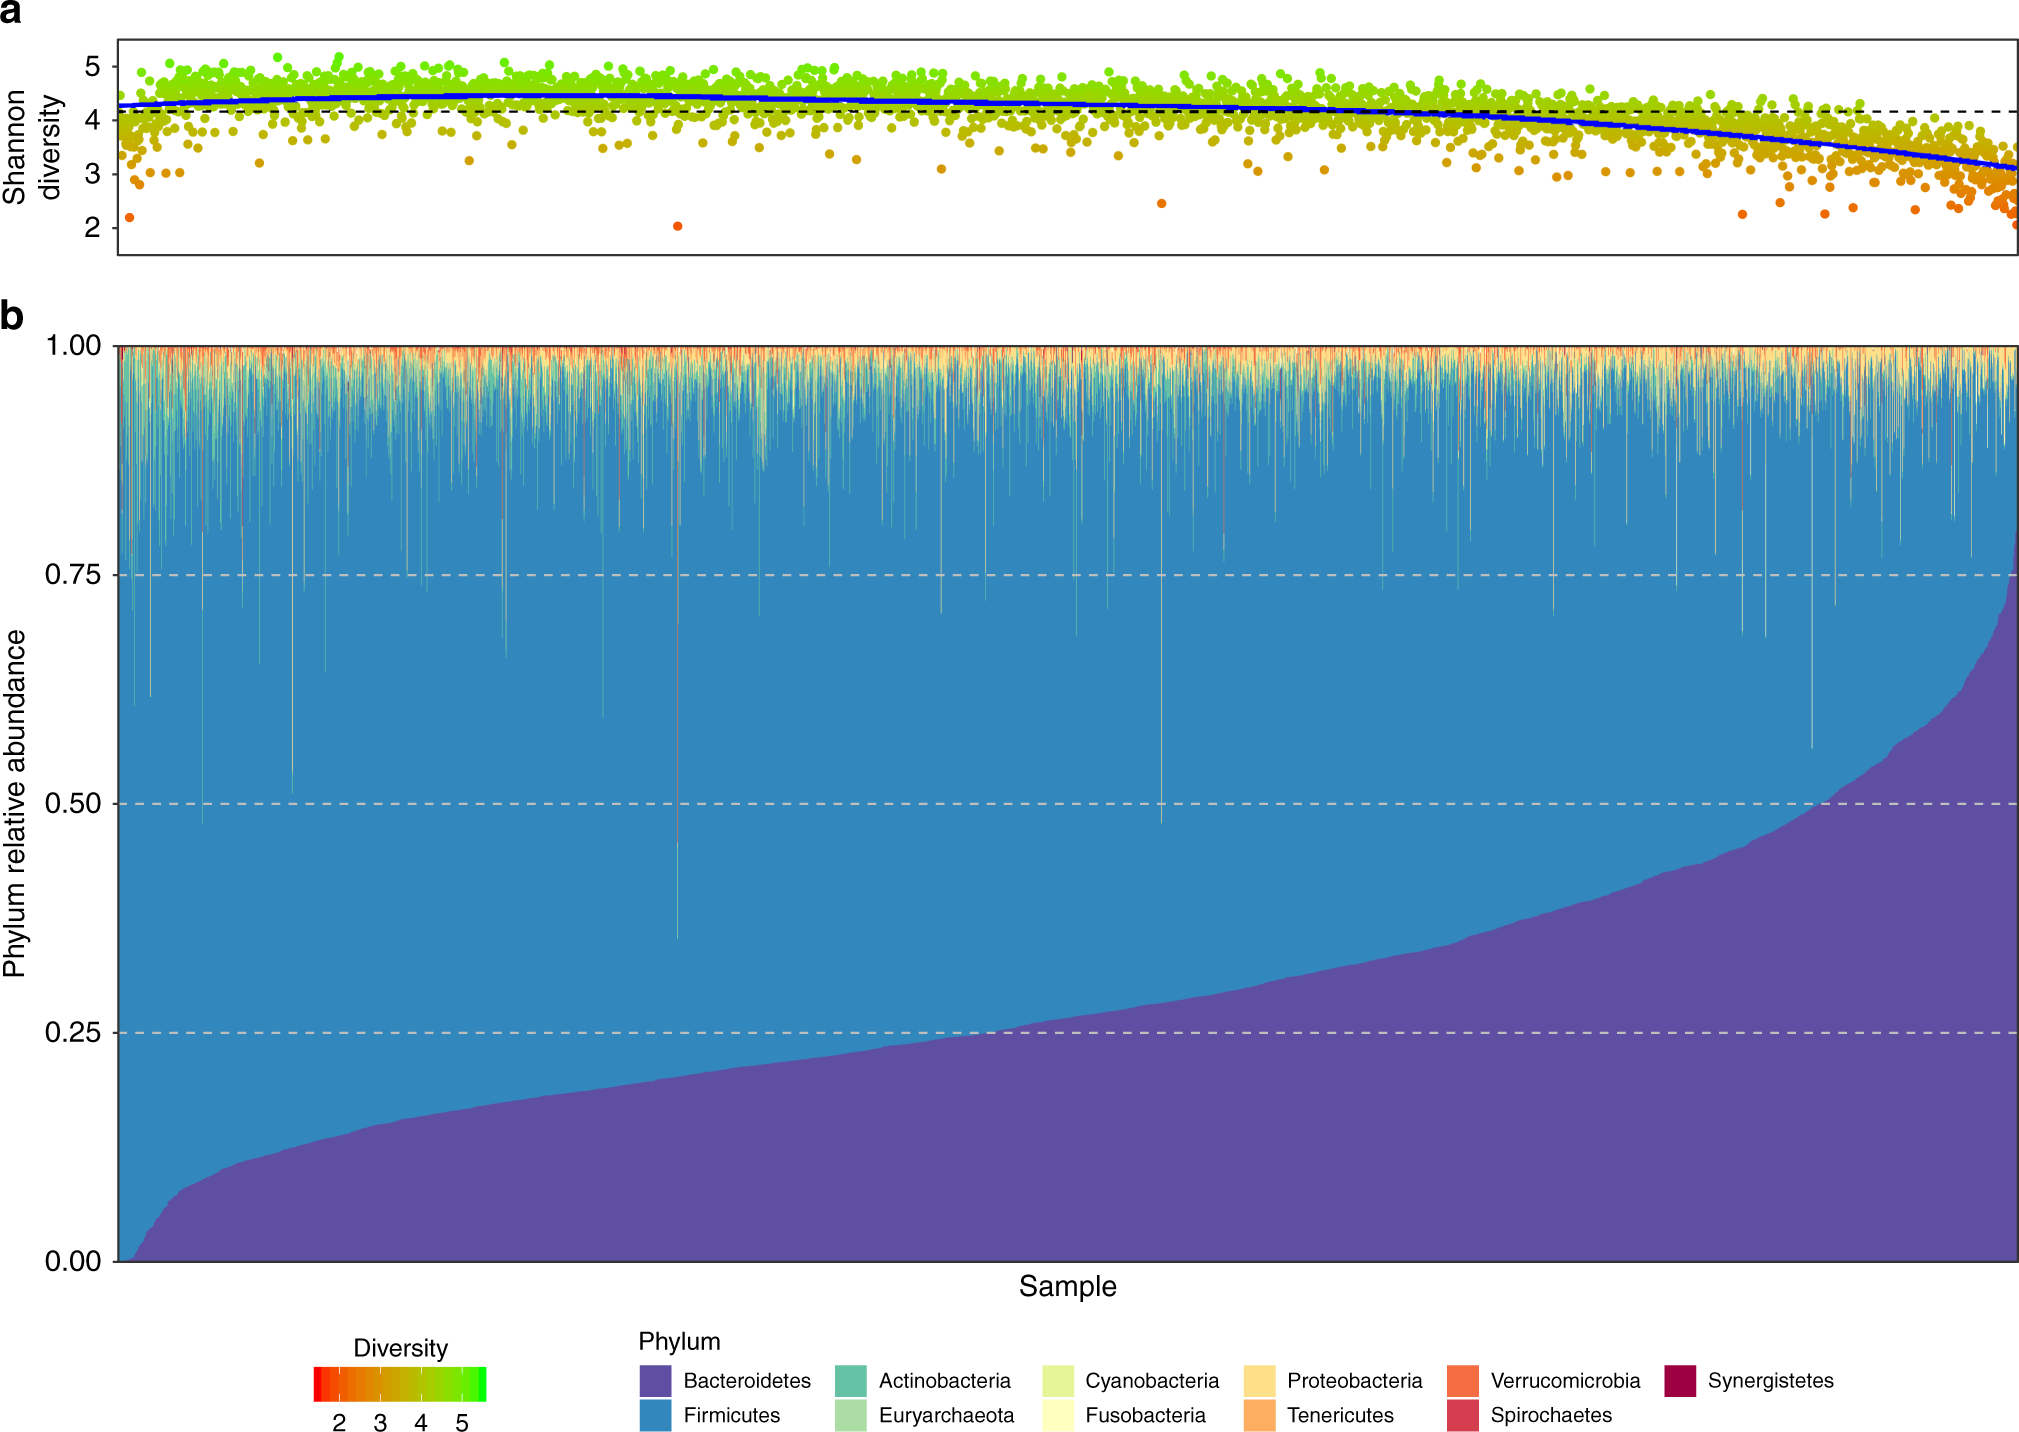
Taxonomy profiling of microbiome samples. A shotgun emphasis
Here, I will show the importance of the taxonomy profiling. Besides I provide a scope of the options to make taxonomic classifications and their pros/con. I start with the basic question: shotgun or amplicon? Then I explain the taxonomy classifiers used for shotgun sequencing: homology-based programs (divided in DNA, protein, and marker-genes algorithms) and similarity-based programs.
Summary
Details
Links to taxonomy profilers
Some references
Summary…
Microbiome research main questions:
- Who?
- Corelations with environmental variables and time.
- Experimental models can be used to confirm corelations.
- What is it doing?
- Explore the functional potential can propose environment/host-microbe interactions and improve the correlational studies
Taxonomy profiling
- Comparison of the microbiome sequences properties against microbial reference genomes.
- Amplicon sequencing
- Uses oligonucleotide probes to amplify specific genome regions. The conserved and hypervariable regions in the ribosome are used as primers.
- 16S – prokaryotes
- 18S – eukaryotic microbes
- ITS – fungi
- Advantages
- Cheaper
- Less susceptibility to contamination
- Precise
- Functional predictions based in reference genomes annotations
- Better databases
- Disadvantages
- It reports a small set of organisms.
- Functional potential of your samples will be ignored. Gene counts inaccessible.
- Low confidence for taxonomic abundance estimation
- Resolution: Genus
- Shotgun sequencing
- All the metagenomic DNA is sequenced.
- Advantages
- It detects bacteria, archaea, viruses, etc.
- Accesses to the functional POTENTIAL in the microbiome
- Resolution: Strains
- Recovers single nucleotide variants
- Better predictions of the taxonomic abundance
- Disadvantages
- Expensive
- More susceptible to contamination
- Less extensive databases: It is more likely to deplete.
- Types of taxonomy profilers
- Reads profiling: More confident representations of the DNA content. Better for fragments shorter than 1 kb
- Homology-based
- DNA: More restrictive than the protein programs.
- Kraken: k-mer based classifier; reads input.
- CLARK: k-mer based; DNA/RNA reads/scaffolds/contigs/etc input; *A single index per taxonomic rank. Lower memory/time consumption.
- Protein: Mutational rate, and taxonomy bias in the incomplete databases makes tricky to ask very strict hits as the DNA programs. Useful in cross reference the reads with a predicted protein with the taxonomy classification of this read.
- MEGAN: reads input. More precision values at higher time/classification rates. Requires previous alignment of your reads. Easy visualization.
- Kaiju: reads input.
- CARMA: reads input. Pfam based.
- Marker-genes: Genes shared across domains, specific clade genes. Reduces classified seqs/false positives; faster.
- MetaPhlAn
- MetaPhyler
- Composition-based: Wider perspective. Smaller db. Useful to classify complex environments. Lower memory requirements and time consumed.
- PhyloPythia (SVM): Assembly input.
- Phymm (IMMs): Reads input.
- PhymmBL: accuracy improvement.
- Assembled microbiome profiling
- Heuristic solutions: use of k-mers. Used in different types of taxonomy profilers.
- Short k-mer length: the precision will be reduced. It is more suitable if your microbiota is composed of distant taxa
- Longer k-mer sizes: more restrictive
- DNA: More restrictive than the protein programs.
- Homology-based
- Reads profiling: More confident representations of the DNA content. Better for fragments shorter than 1 kb
- Uses oligonucleotide probes to amplify specific genome regions. The conserved and hypervariable regions in the ribosome are used as primers.
- What should I consider?
- Resources
- Expertise
- How many samples do I have?
- Do I have a complex environment?
- Priority: Taxonomy or functional potential?
- Expected resolution
- Do I suspect taxonomically distant taxa in my samples?
Some details…
Links: Taxonomy profiling programs…
Some references…
https://bmcgenomics.biomedcentral.com/articles/10.1186/1471-2164-12-S2-S4
https://genomebiology.biomedcentral.com/articles/10.1186/gb-2014-15-3-r46
https://www.ncbi.nlm.nih.gov/pmc/articles/PMC6716367/#!po=5.55556
https://www.nature.com/articles/ncomms11257
https://academic.oup.com/bioinformatics/article/30/24/3548/2422251
https://www.nature.com/articles/nmeth976
https://www.nature.com/articles/nmeth.1358
https://elifesciences.org/articles/65088
https://genomebiology.biomedcentral.com/articles/10.1186/gb-2014-15-3-r46
https://www.ncbi.nlm.nih.gov/pmc/articles/PMC6716367/#!po=5.55556
https://link.springer.com/referenceworkentry/10.1007/978-1-4899-7478-5_736
https://pubmed.ncbi.nlm.nih.gov/17179938/
https://www.ncbi.nlm.nih.gov/pmc/articles/PMC1800929/
https://www.nature.com/articles/nmeth.2066
Fig. 1 created with BioRender.com

